Every business needs the right data to measure the effectiveness of current strategies and to plan for future success. But while there are many Key Performance Indicators (KPIs) that can be tracked, it’s important to choose the most relevant mix for your business and your current goals in order to be effective.
That’s why I’ve put together the most commonly tracked, impactful ecommerce KPIs and their uses so that you can determine the best set to monitor your business's online performance from attracting customers to converting buyers online.
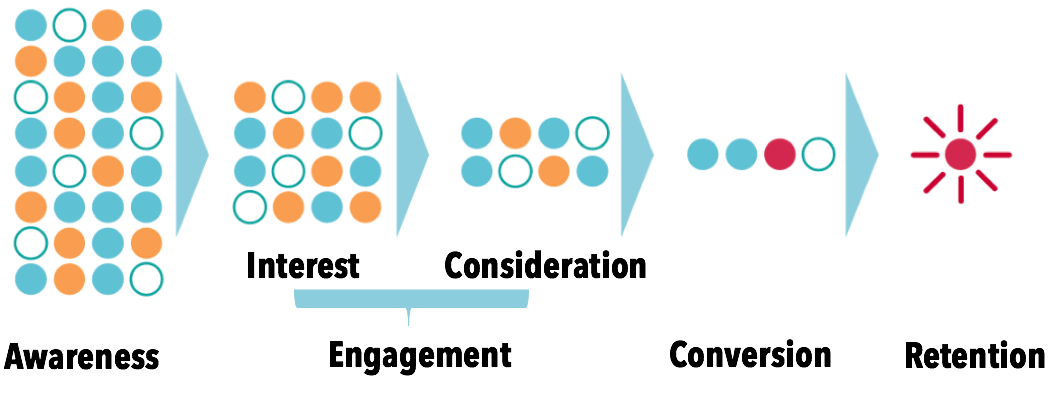
When it comes to tracking your success, most businesses choose goals that focus on leads and closed sales. To understand the effectiveness of your strategies at different points in your sales funnel, many break out their tracking into general phases in the sales cycle on top of broad revenue performance.
The awareness stage of the buyer’s journey occurs when consumers are just becoming aware of your product or service. These KPIs reference how an audience notices and responds to your ads and social media campaigns.
The engagement stage consists of both interets and consideration and sees potential customers interacting with your content to get more information on the products and services you provide. These KPIs focus on how prospects interact with your site and ad campaigns.
These KPIs track how effective your business is at turning visitors into customers. These KPIs track the actions your prospective customers are taking, whether it’s a trial sign-up, a sale or something negative like an abandoned cart.
These KPIs relate to sales and growth.
These are critical indicators since they relate directly to your financial health and growth. These KPIs detail how effective you are at getting customers to stay or return and generate positive reviews.
If you're ready to dive into the details, keep reading!
One of the most important insights for ecommerce businesses is determining how people discover you. You can’t win new customers if they can’t find you or know that your solution exists.
Here are five ways to see how your different channels resonate with an audience at the top of the funnel.
Organic search measures visitors to your website through search engine results, as opposed to advertisements or inbound links. These center around what people actually put into search engines, making it important to track KPIs related to these keyword terms rather than looking at your overall traffic referrals from organic search.
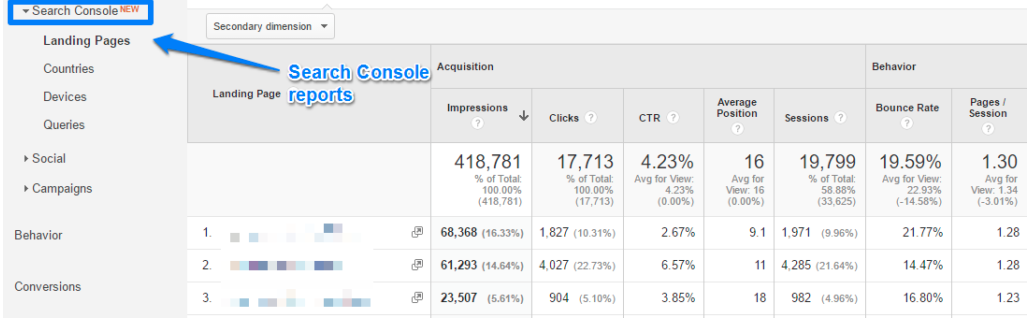
Luckily, Google Analytics makes it easy to track your average position, impressions and clicks-throughs coming for specific search terms. These three KPIs are defined as follows:
Average Position: The average rank that a particular page appears in results for certain search terms over the period of time you’re tracking.
Impressions: The number of times your page appears on a search engine page regardless of whether it is clicked on.
Click-Through Rate: The number of clicks on your result divided by the number of times the entry appeared (impressions)
To find these KPIs, go into the Acquisition tab of your Google Analytics account and hit Search Console > Queries. If you don't have Search Console configured in your analytics account yet, here's how to do it.
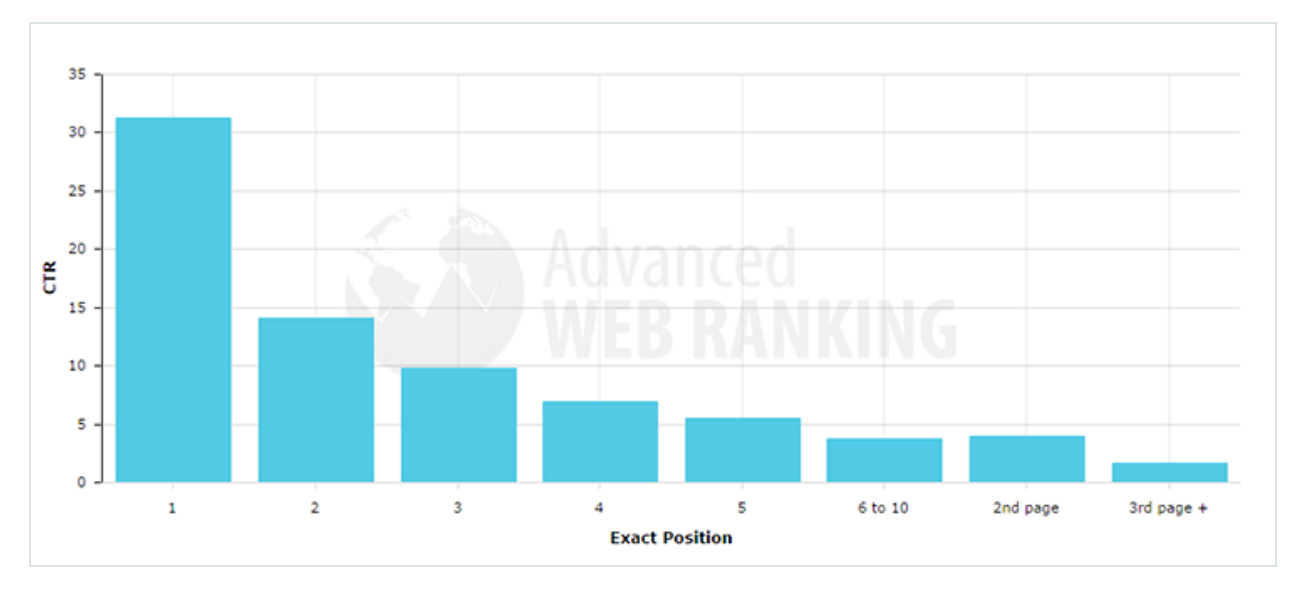
(Courtesy MOZ Blog)
The data from this study is pretty compelling:
Your average rank and the impressions and clicks that come from it are essentially a test of your site’s Search Engine Optimization, or SEO, for certain target terms. Obviously, if you can get on the first page of results for what your customers would be searching for, it can be a huge boost to your visibility. If your SEO needs improvement check for elements that could be hurting your search rankings.
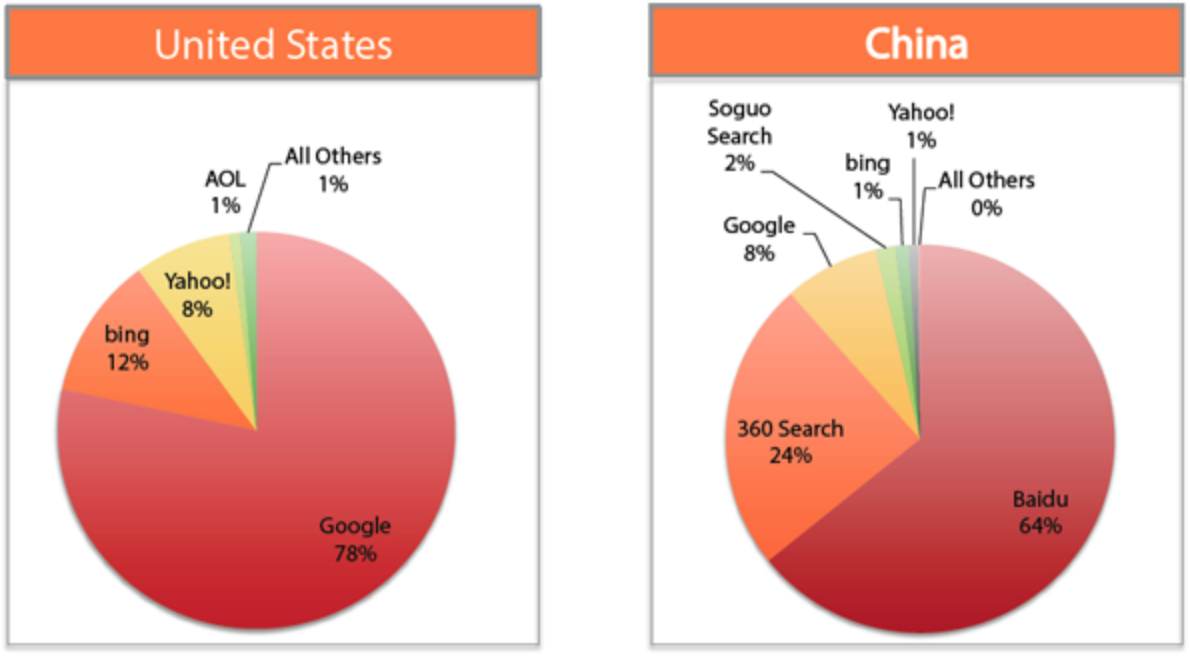
To bolster your visibility with search engine marketing, all search engines have options to have paid advertisements or listings on their results pages. Google is the obvious leader with over 78% of the U.S. search market and 77% of the global market. But if you're targeting other countries you need to make sure you know which paid programs to invest in. In China, for example, Google may not be your best choice.
You can choose to pay either per click or per impression, and the more demand for a keyword or phrase related to your business, the more expensive bids on it will be. Ideally, you should be aiming to get both your clicks per lead and your cost per lead as low as possible to maximize your return on ad spend (ROAS).The KPIs included in this bucket can be defined as follows:
Clicks Per Lead – The number of total clicks on an ad divided by the number of leads brought in by that advertisement, expressed as a percentage. Alternatively, in a B2C business, you can track clicks per sale.
Cost Per Conversion – The total spend on a campaign divided by the number of leads it brought in, expressed as a percentage.
ROAS – This metric measures gross revenue generated for every dollar spent on advertising. It is an advertiser-centric metric that gauges the effectiveness of online advertising campaigns. ROAS = Campaign Revenue / Campaign Cost.
Sales Accepted Leads (SALs) – Usually only applicable in a B2B sales cycle, SALs are leads that have been qualified by marketing based on pre-defined criteria and passed to the sales team.
All ad platforms offer numerous features to optimize your paid campaigns and your target KPIs. Therefore, it's worth familiarizing yourself with all the functionality offered to make sure that your ad budget is wisely spent. For example, you might want to explore:
While we're on the topic of A/B testing, check out this blog article for some great ideas on testing your cart checkout page.
The amount of time people spend on social media makes it a prime channel to generate awareness. With effective attribution modelling in place, you may be surprised at just how much these social efforts actually contribute to your bottom line.
There are a few different areas that you can focus on – audience reach, impressions, engagement and clicks. These are defined as follows:
Audience Reach –An aggregate of your followers across your social channels.
Impressions – Total number of times a post or page has been seen by users.
Engagement – This is another aggregate number that can include likes, reactions, retweets, comment and shares.
Clicks – The number of users clicking through to your website or posts from a social channel.
These metrics (both organic and paid) can be tracked across the different platforms including Facebook, Twitter, LinkedIn and Google+ using their native insights or analytics interfaces, or through social aggregation tools like FanPageKarma.If you're looking to better track, measure and understand your social channels, here are 26 free social media analytics tools for you to try.
Earned media is a particularly powerful way to grab the attention of potential customers. It refers to publicity gained through media without paid advertising. There are a number of solutions that crawl the web and social media looking for earned media mentions, one of the most powerful is included in Salesforce's Social Studio. Earned media defined:
Earned Media – total number of mentions of your brand by third parties where you weren’t paying for advertising.
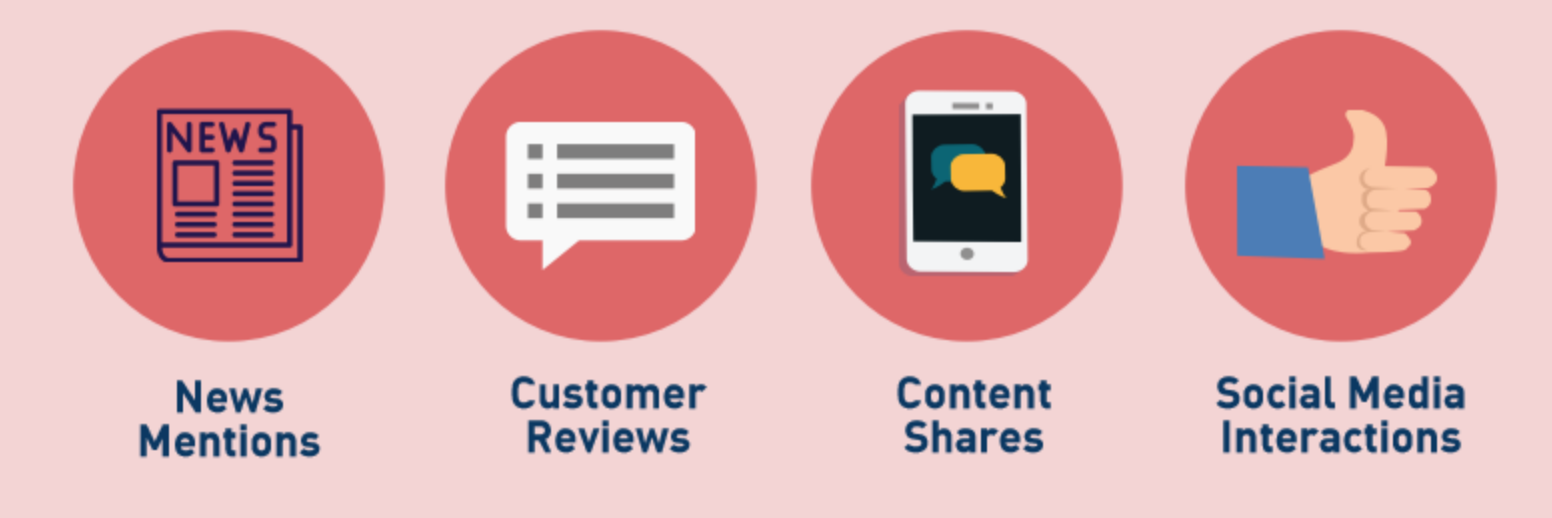
These mentions can also provide backlinks which are extremely valuable for SEO. There are services that incorporate these mentions to calculate your overall influence on the web including Klout, which will calculate your influence and give a score between 0 and 100. The more mentions and influence you have online, the better your chances of attracting more customers.
Regardless of the channel used to attract the attention of new potential customers, your customer acquisition cost is the general metric used to track the success and sustainability of your campaigns.
Customer Acquisition Cost: Simply put, it is calculated by summing all your marketing expenses and averaging on a per new customer basis.
Once shoppers are aware of your business and have a need that your business can meet, you can start to see how your mid-funnel is performing in moving them towards a conversion. Generally, you’ll be most interested in how they’re engaging in the customer journey and the path they take to hit the checkout button.
Here's how to understand the resonance of your difference channels with an audience during their interest and consideration stages.
Your ecommerce site is likely the most important tool you have to turn browsers into customers. That’s why you want to ensure that users are engaging with the content on your site or landing pages
The time on page, page views and bounce rate can be particularly informative. They tell you which pages are cluttered, confusing or have hard to find links. Here are the definitions:
Time on Page: The average amount of time users are spending on a webpage.
Page Views: The number of pages viewed by visitors.
Bounce Rate: The percentage of visitors who navigate to your webpage, then leave without clicking anything to navigate to another part of your site.
Micro-Conversions: These can represent a number of things based on your specific goals for your specific sales funnel. It could be a click-through to a checkout page, a newsletter sign-up or creating an account. Most importantly, they always represent forward progress in the buyer’s journey. They can be tracked as either goals or events in Google Analytics.
The number one thing these KPIs tell you is how closely visitors are reading your content and considering your product. If you want to boost time on page and lower your bounce rate, try adding white space, rearranging your landing pages or testing content changes. Investigate and test webinars, videos, infographics, more use of emotionally engaging imagery, quizzes and surveys.
All your efforts have pointed prospective shoppers to this point. It’s where shoppers either finally cross the boundary and become your customers or they hesitate and leave. Understandably, this is a critical stage to monitor because it has such a huge impact on your overall success and revenue.
A broad measure of how successful you are at conveying value while alleviating anxiety and hesitation is your conversion rate and cart abandonment rate. If you can’t close the sale, you need to figure out what is causing people to hesitate and abandon their purchase just before they check out.
Conversion Rate: The percentage of visitors to your site that have completed a purchase. This calculation is can be handled automatically by most analytics programs, including Google Analytics, assuming that you have set your goals for the program to track.
Cart Abandonment Rate: The number of shoppers who navigate to the checkout page but fail to complete a purchase.
According to Baymard, the average cart abandonment rate is around 70%, although this number varies depending on the industry. Some of the most commonly cited reasons to abandon a purchase before checking out include excessive fees at checkout (taxes, shipping, handling), requiring mandatory accounts for purchases and long, complicated checkout processes.
Some well-established ways to increase conversion rates include a simple checkout, a localized customer experience, security seals and multiple payment options.
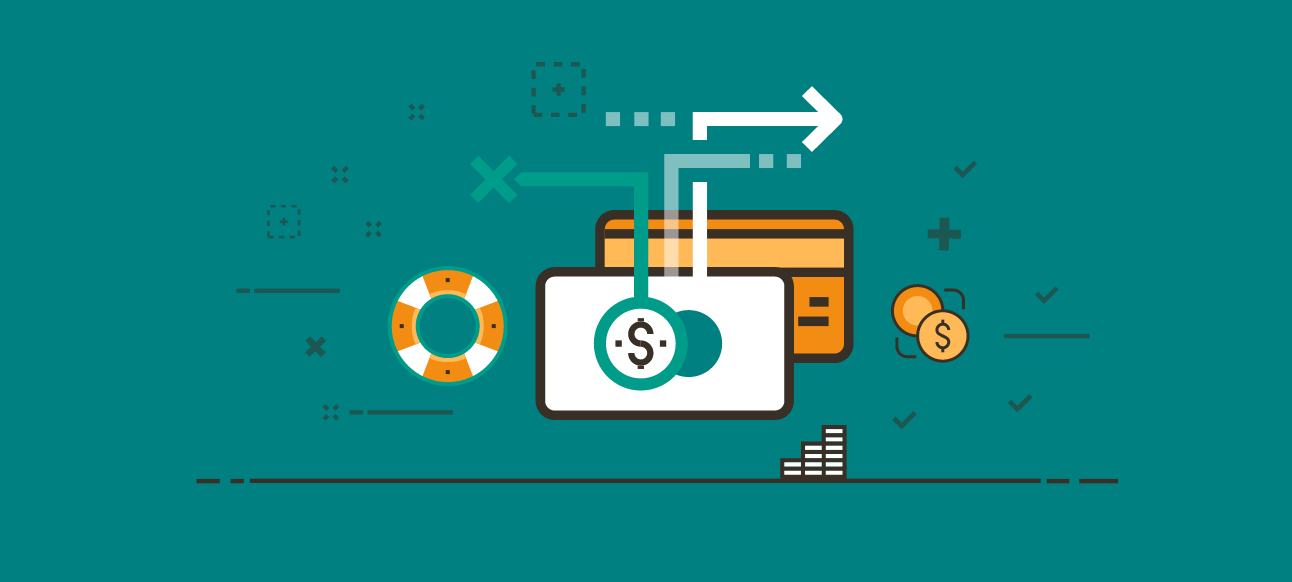
Declined transactions can also quickly add up to a lot of missed revenue. To keep your failed transaction rate as low as possible, you can offer multiple payment options and integrate with more than one payment gateway so that if the first attempt fails, another gateway is automatically attempted.
Failed Transaction Rate: The percentage of transactions that are declined because of a payment issue divided by the total number of transactions.
You can also implement retry logic and a dunning management system to recover failed transactions for recurring payments. Retry logic attempts to charge a card again at a different time, while a dunning management system alerts the customer of a failed transaction and prompts them to update their payment information.
Finally, if you try to increase your revenue with upsells or cross-sells in your checkout path, you can monitor the success through average order value.
Average Order Value: AOV is calculated by simply dividing your total revenue by the number of sales for any given period.
Revenue is important to track not only to understand the current health of your business but also to plan for your future strategies and growth. While it may seem obvious that you want this to be increasing, be sure to segment to understand where and how you are earning the most revenue.
While all companies track their revenue growth, successful ones understand their revenue sustainability so that they can predict their future earnings. This means accounting for average revenue and costs on a per customer basis in addition to monitoring sources of missed revenue opportunities.
Customer Lifetime Value (CLV)
It’s vital to optimize this KPI to get a more robust and predictable revenue stream. With selling to existing customers being much easier and less expensive than attracting new ones, you need to ensure your customer’s experience after purchase is excellent. If your customers aren’t finding success with your product, you’ll quickly see your refund and chargeback rates rise with no repeat purchases. Therefore, stay focused on the value you provide your clients or refunds and chargebacks will start to gut your revenue. Read more about CLV and how to improve it here.
Chargeback Rate: When a bank forcibly initiates a return of funds to a customer. This typically occurs when a customer complains about a card charge to their bank, who then reverses the transaction made with a debit or credit card. The Chargeback Rate is the percentage of all transactions that result in a chargeback.
Refund Rate: The number of refunds given over an amount of time, divided by the total sales over that same period.
Chargebacks can be particularly costly. In addition to a fee charged by the bank, if a merchant’s chargeback rate tops 1%, they are usually suspended from a payment gateway. Minimize chargebacks by being up front and clear about payments, deal with customer service issues promptly, keep good records and watch for the signs of fraud.
Calculating a CLV:CAC ratio can tell you if your costs to attract new customers is sustainable, specifically by comparing the average Customer Life Value (CLV) with the average Customer Acquisition Cost (CAC). Unlike other, more versatile KPIs, the CLV:CAC ratio tells you only one thing: whether you’re spending too much to acquire new customers by channel.
CLV:CAC Ratio: Otherwise known as Customer Lifetime Value: Customer Acquisition Cost Ratio, measures the average revenue derived from each new customer against the cost to acquire them.
If you want to improve your CLV:CAC ratio, there are a few things you can try. Rethink your advertising campaign, try focusing on different demographics, or try to better incentivize your current customers to keep coming back.
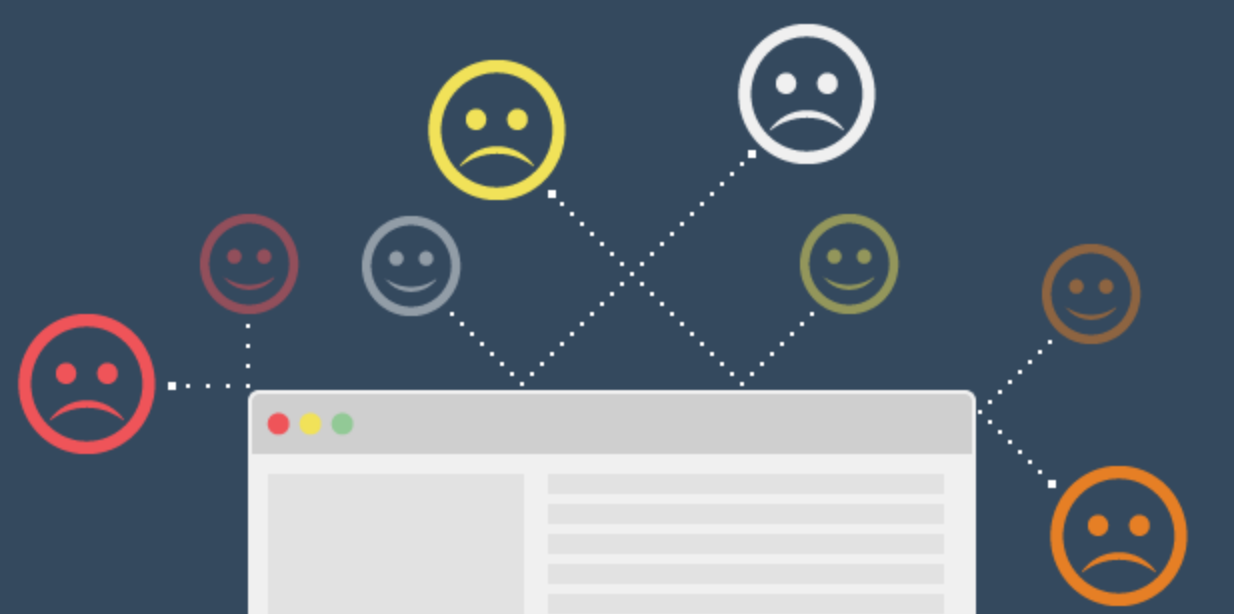
The question then becomes – how do we tell if our customers are happy? While high refunds and low sales can give you an indication that something needs to be improved, it doesn’t provide qualitative customer feedback that you can use. This is where Net Promoter and Customer Satisfaction Scores become invaluable.
Net Promoter Score
Word-of-mouth has always been one of the most important forms of advertisement. But before the internet, it was very difficult to calculate. Surveys tend to be the best way to find your customer’s opinions and whether they’d recommend you to their friends. When retailers began sending these surveys online, the response rate shot up and the Net Promoter Score (NPS) became one of the most important KPIs for determining customer satisfaction because it indicates how likely your customers are to generate positive word-of-mouth referrals.
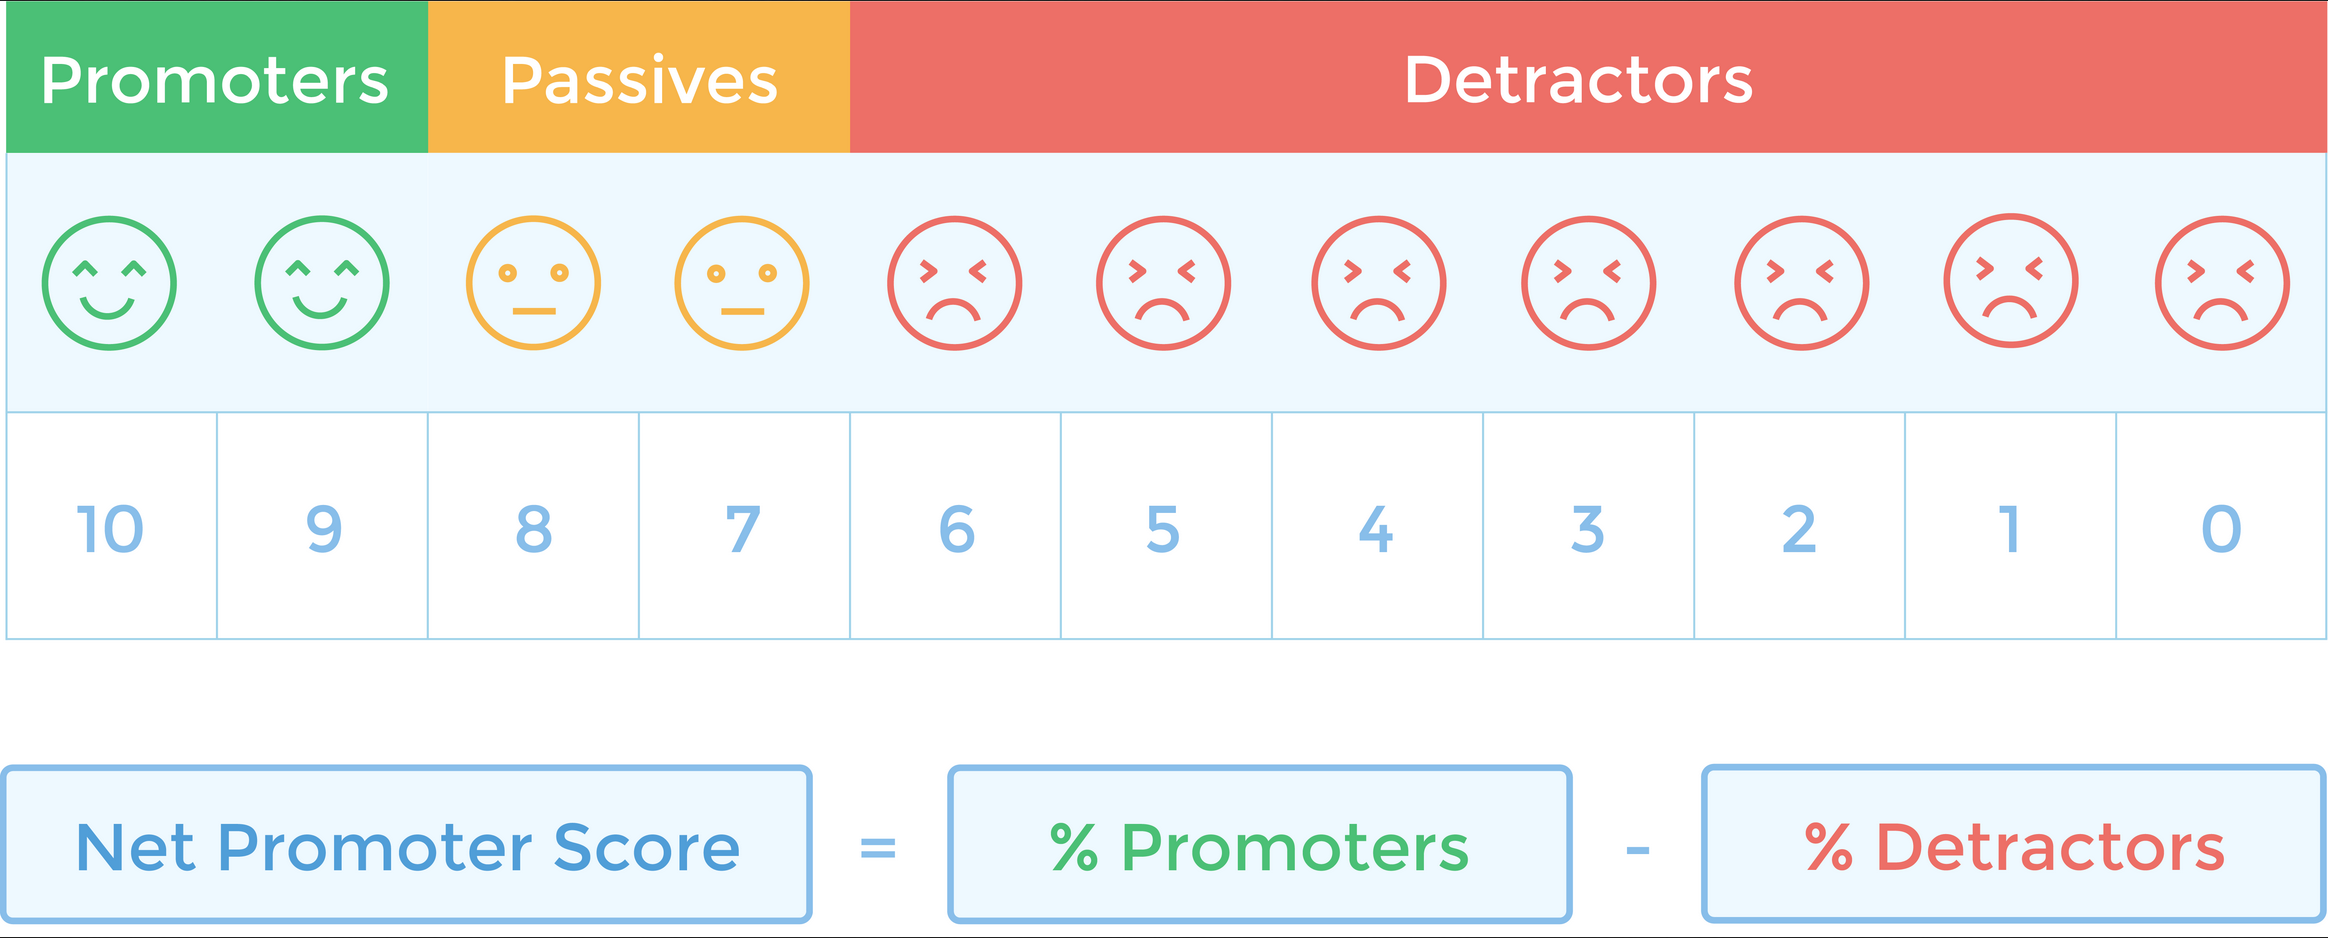
To calculate your NPS, the first step is to ask your customers to rate themselves on the Net Promoter Scale. Ask them to rate how pleased they were with the product on a scale from 1-10. The answer represents how likely customers are to recommend your business to their friends.
The calculation for NPS is as simple as subtracting the percentage of customers who are Promoters from the percentage of customers that are Detractors. This will result in a score that ranges from -100 to 100.
A good NPS varies by industry but is usually above 75, and hopefully, close to 100. If your NPS is struggling, look for ways to personalize your sales process or provide more exceptional service.
Customer Satisfaction
Customer satisfaction might seem like an obvious KPI, but it’s one of the most difficult KPIs to track accurately. Customers who go out of their way to rate your business or fill out a survey tend to have extreme opinions, either positive or negative.
If you do send out a survey, try to gather as much relevant data in as few questions as possible. A great one is “How likely are you to recommend our business to friends and colleagues?” (See Net Promoter Score for how to use the answer).

Repeat Customer Rate
Your Repeat Customer Rate (RCR) represents the percentage of your customers that come back for multiple purchases. This metric is great indicator for your customer retention, loyalty and product value, which are traditionally difficult to calculate. This KPI is most often used by strategic business leaders, marketers and customer service representatives to evaluate performance.
KPIs are essential for monitoring the health of your business and planning for the future. However, for ecommerce businesses especially, certain KPIs are going to be more telling than others depending on what your goals are, and these can change over time.
These big numbers can mask problems that you need to identify to continue to be successful. Data segmentation by time period, demographics, region, lead source or other variable is essential for finding and fixing revenue leaks or identifying untapped opportunities.
Sometimes patterns that aren’t visible over days or weeks become visible when you examine the data for months or quarters, and vice versa. Once you find out what’s working well and what isn’t, you can invest in strategies that move the needle further in the right direction.
Good luck and happy measuring!


